Originally published November 11, 2026, at 17:22 (UTC+8). This article summarizes an analysis by matteo, translated by TechFlow. The measurements below describe the periods studied, not current market conditions.
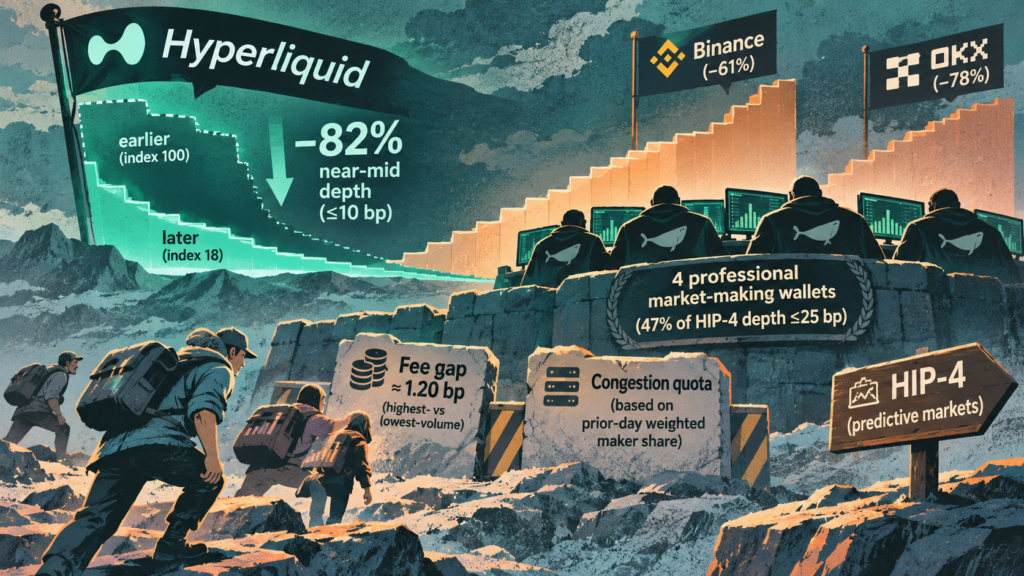
Hyperliquid’s long-tail markets once stood out for their order-book depth. In an analysis drawing on more than 18 months of full order-book data accumulated through trading at 0d Labs, matteo found that liquidity close to the mid-price had deteriorated sharply. The central question is whether this reflects a broader decline across altcoin markets, a change specific to Hyperliquid, or both.
Comparing the same assets across venues
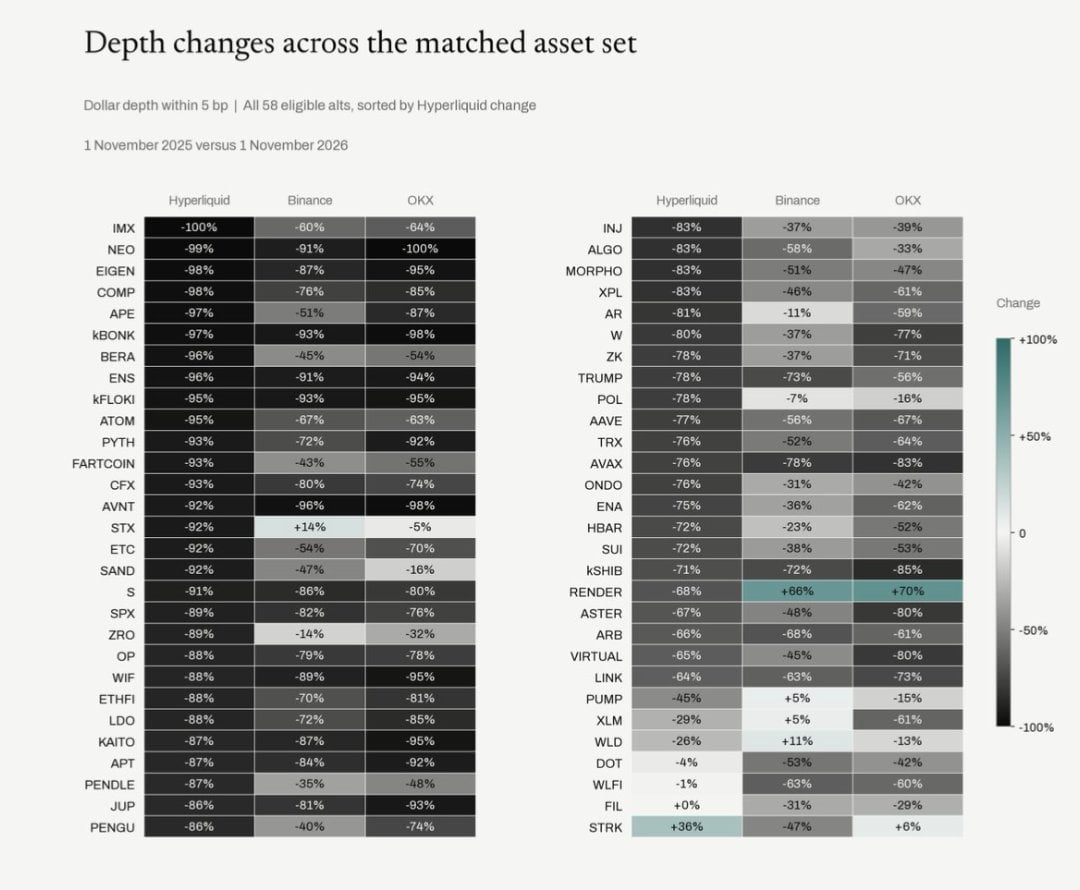
The analysis used Binance as a market benchmark and compared assets traded on both venues with leverage below 10× between November 1, 2025, and November 1, 2026. That selection produced 86 long-tail assets; individual measures used smaller matched samples and should not be treated as interchangeable.
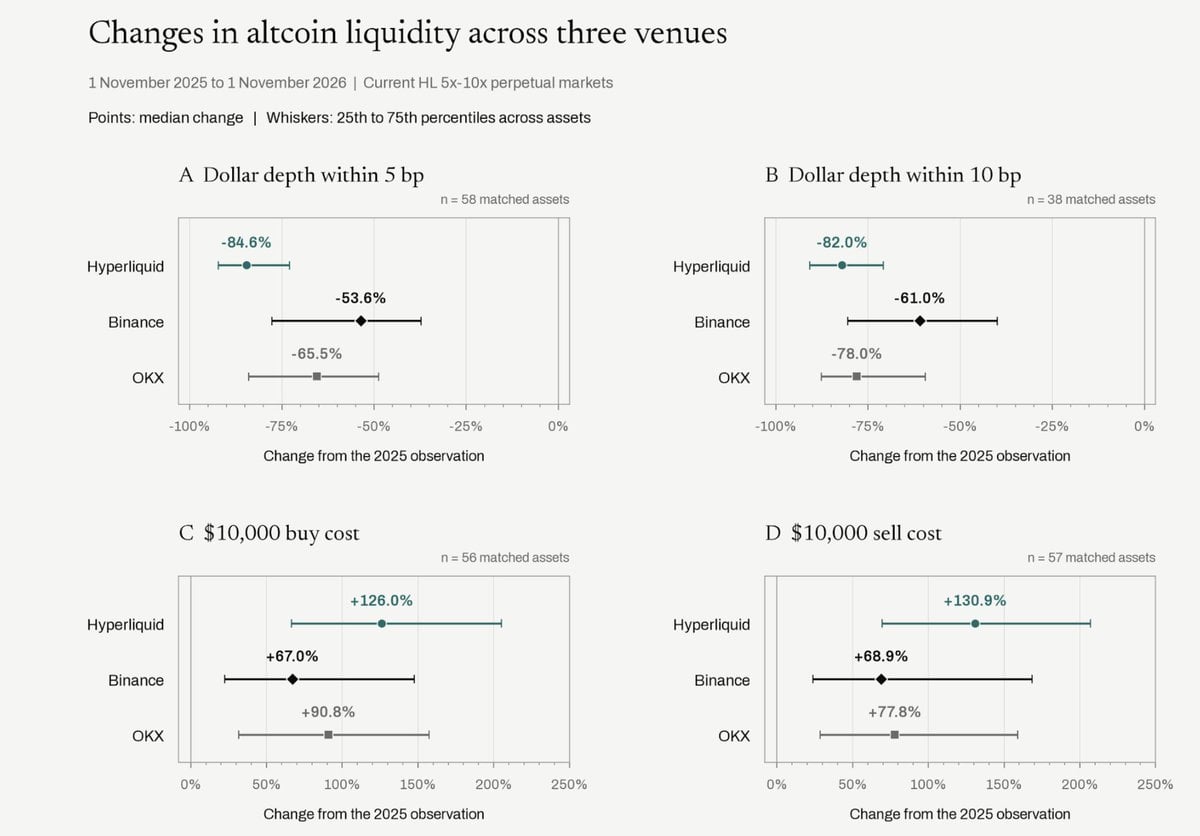
Among 38 markets comparable within 10 basis points (bp) of the mid-price, median dollar-denominated depth fell 82% on Hyperliquid, versus 61% on Binance and 78% on OKX. To account for broader market changes, the author also calculated each asset’s Hyperliquid-to-Binance depth ratio before taking the median across markets. At 5 bp, that median ratio fell 57.5%. It was not calculated by dividing one venue’s overall median by the other’s.
In the later sample, the median order-book impact cost of buying $10,000, before fees, was 5.21 bp on Hyperliquid and 2.95 bp on Binance—$5.21 and $2.95, respectively. Binance’s proportional spread widening was slightly greater, but its spreads started and ended narrower.
Fewer tokens near the mid-price—not just lower prices
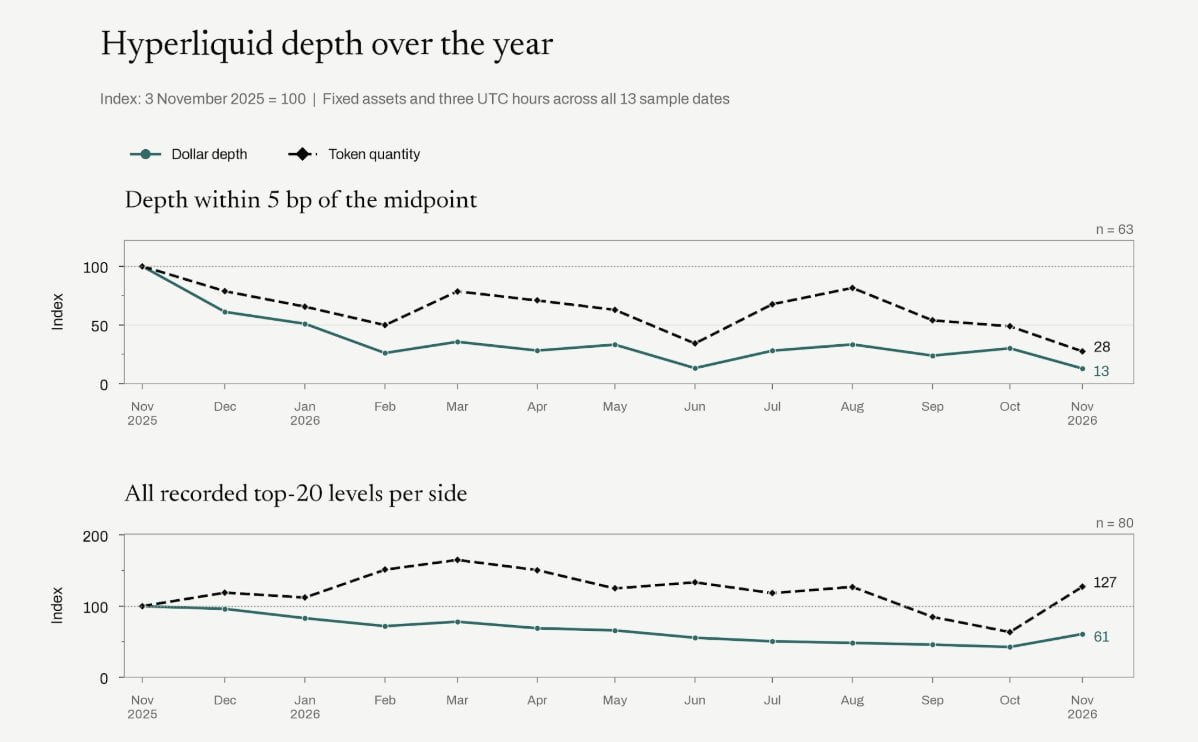
A fall in token prices can reduce dollar-denominated depth even if the number of tokens quoted stays constant. The author therefore tracked both measures over 13 sampling dates, holding the asset set and observation windows fixed. With November 3, 2025, set to an index value of 100 for each market, the median 5 bp depth index ended around 13 in dollars and 28 in token quantity across 63 markets. For the first 20 order-book levels on both sides, the corresponding indices were 61 in dollars and 127 in token quantity across 80 markets.
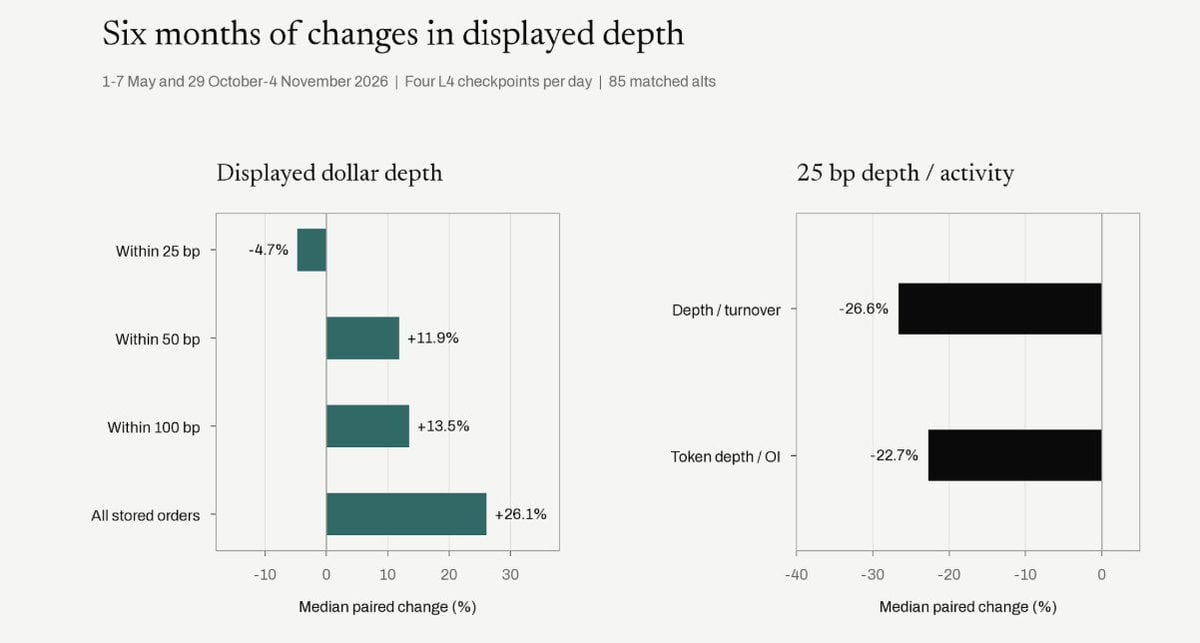
The distinction matters: the sampled books retained, and by the token-count measure gained, size farther from the mid-price while losing much of the quantity quoted close to it. This time-series sample was selected more strictly than the two-date cross-venue comparison, so its endpoint cannot be substituted for that comparison. A separate six-month view of 85 matched altcoins likewise found improvement in broader depth, rather than in the quotes nearest the best bid and ask.
Competition, costs and unresolved causes
Account-level evidence does not support a simple account of one large market maker absorbing all trading. After grouping main accounts with their explicitly linked subaccounts, the analysis compared one week a year earlier with a recent week across the same 80 markets. The median share of maker-executed volume held by the largest account family fell from 25.2% to 14.6%.
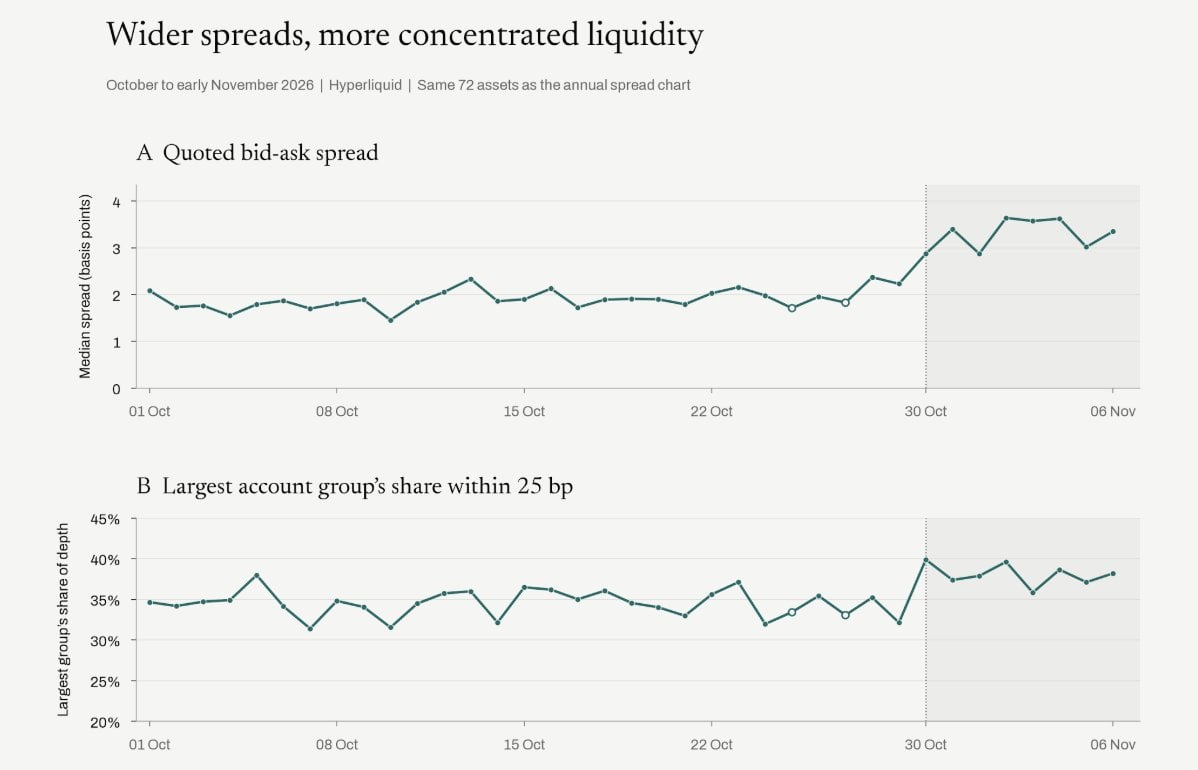
The more recent quoting picture was different. Across 72 matched assets, comparing October 8–14 with October 31–November 6, the median share of depth within 25 bp held by each market’s largest account group rose from 34.5% to 38.6%, while the median quoted spread widened from 2.13 bp to 3.55 bp. The median number of account families quoting at least $1,000 on each side within 25 bp declined from 7.64 to 6.39. After recalculation at fixed token prices, 58 of the 72 markets still showed fewer active market-making accounts.
Those observations do not establish why the change occurred. The comparison window included a Binance security event on October 29, and the author also observed a large liquidity provider sharply reducing quotes around November 3 before other account families took up share. Neither priority fees nor network congestion can be identified as the cause from these curves alone.
Fees nonetheless show a measurable difference in starting economics. For 54 account families, volume-weighted historical maker fees averaged 0.961 bp paid by the lowest-volume quartile, while the highest-volume quartile received a 0.236 bp rebate—a gap of about 1.20 bp before hedging costs or losses from adverse fills.
Why HIP-4 raises the stakes
The author describes Hyperliquid’s congestion quota as based on an address’s weighted maker share on the preceding UTC day, allowing twice that share of block space during high congestion. Traders cited in the analysis said congestion could prevent them from quoting normally on HIP-4. That feedback points to a potential obstacle for smaller entrants, but does not by itself quantify the rule’s effect on liquidity.
In a November 10 sample of 256 HIP-4 contracts, just four professional market-making wallets supplied 47% of depth within 25 bp of the mid-price. The finding shows how important those wallets were to the sampled books; it does not establish what HIP-4 liquidity would look like without them.
The evidence is strongest for a narrower conclusion than a single-cause explanation: in the measured long-tail markets, Hyperliquid lost substantial liquidity near the mid-price relative to Binance, and its recent quoting participation weakened. The fee gap and congestion rules provide reasons to examine smaller makers’ ability to compete, while the account data and intervening events leave the precise causes of the decline unresolved.
Source: techflowpost.com (originally published 2026-11-11 17:22 UTC+8)