Hyperliquid’s long-tail perpetual markets have lost near-mid-price depth relative to Binance, according to an analysis by matteo using more than 18 months of order-book data accumulated through 0d Labs’ trading operations. The findings describe a deterioration in quoted liquidity, but do not establish a single cause.
The cross-venue comparison
The study’s long-tail sample comprised 86 tokens listed on both Hyperliquid and Binance with maximum leverage of no more than 10×. Its comparison period ran from November 1, 2025, to November 1, 2026; the analysis also compared eligible markets with OKX.
Among 38 comparable trading pairs, the median decline in dollar-denominated depth within 10 basis points of the mid-price was 82% on Hyperliquid, versus 61% on Binance and 78% on OKX. Falling token prices can reduce dollar-denominated depth without removing token-denominated orders, so the study also examined order quantities. Calculated separately for each token, the median ratio of Hyperliquid to Binance depth within five basis points fell 57.5% over the year. That figure is not a ratio of the venues’ aggregate median depths.
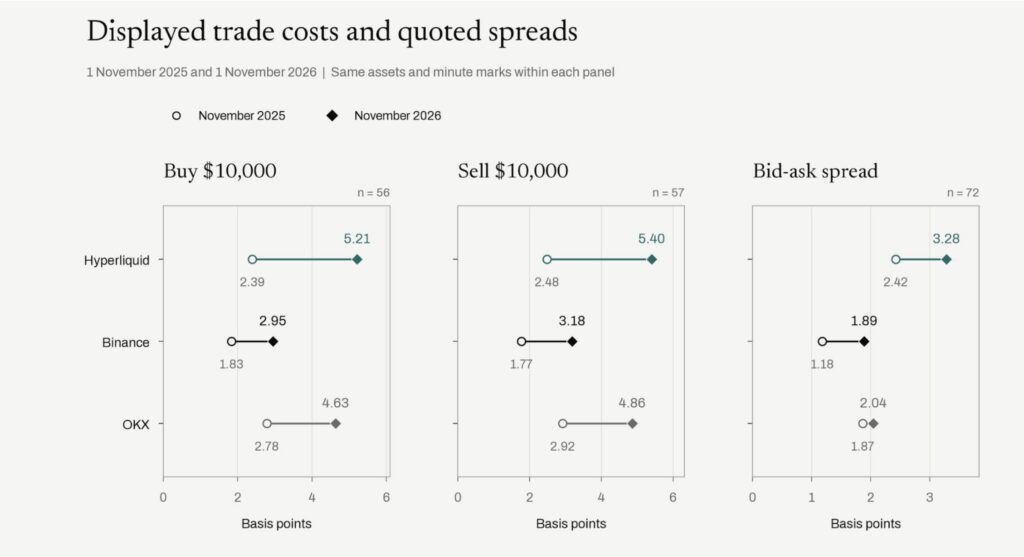
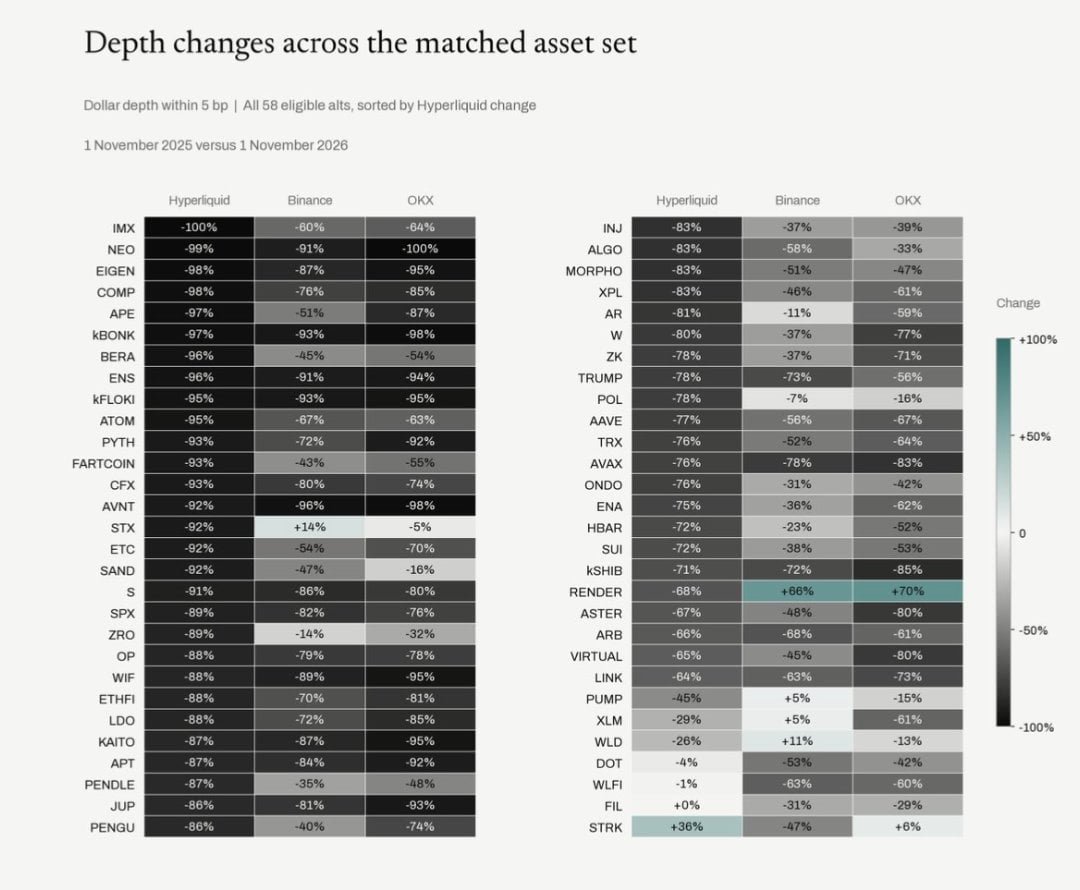
In the later sample period, a hypothetical $10,000 buy order had median order-book slippage of 5.21 basis points on Hyperliquid, compared with 2.95 basis points on Binance, excluding fees. A separate heatmap covered year-on-year changes in five-basis-point dollar depth across 58 long-tail tokens. The study reports that most showed larger liquidity declines on Hyperliquid than on Binance and OKX.
Depth shifted away from the mid-price
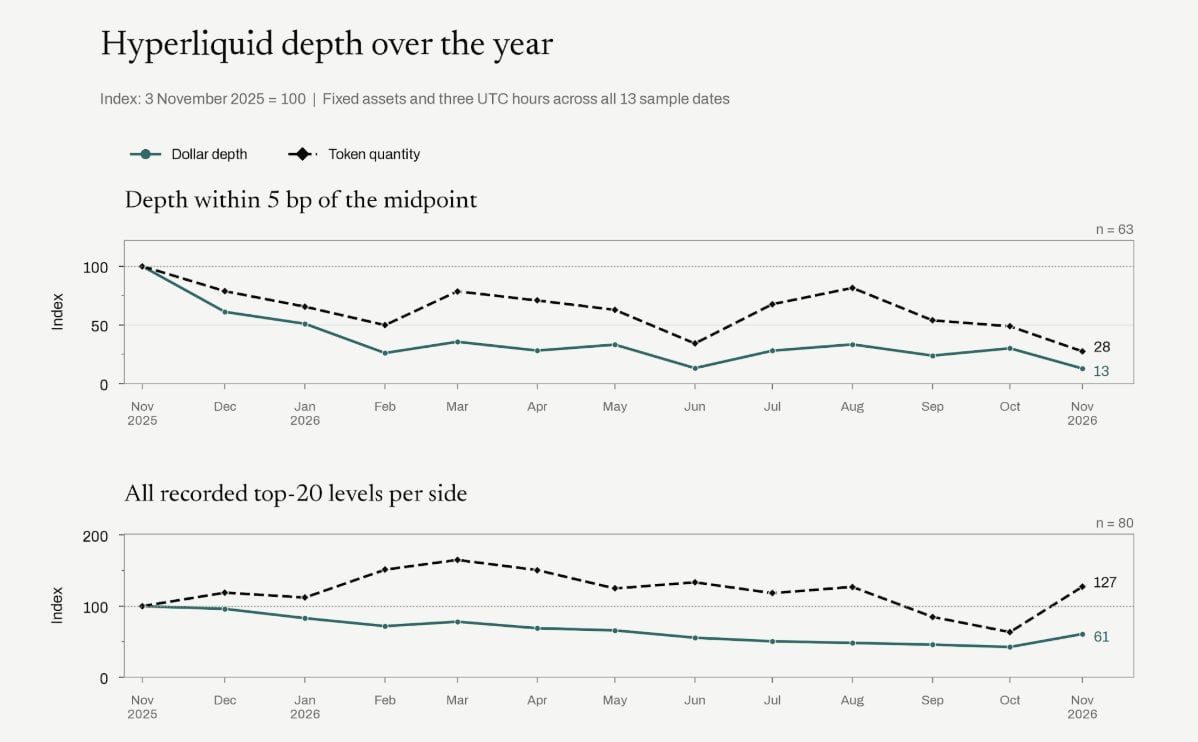
A stricter, separate Hyperliquid sample tracked 13 observation sets: 63 markets for depth within five basis points and 80 for depth across the first 20 order-book levels. These results should not be treated as directly interchangeable with the cross-venue sample. With November 2025 set to an index of 100, median five-basis-point depth fell to 13 in dollar terms and 28 in token quantities roughly a year later. Across the first 20 levels, the corresponding medians were 61 and 127. Orders had not disappeared uniformly; the steepest deterioration was closest to the mid-price.
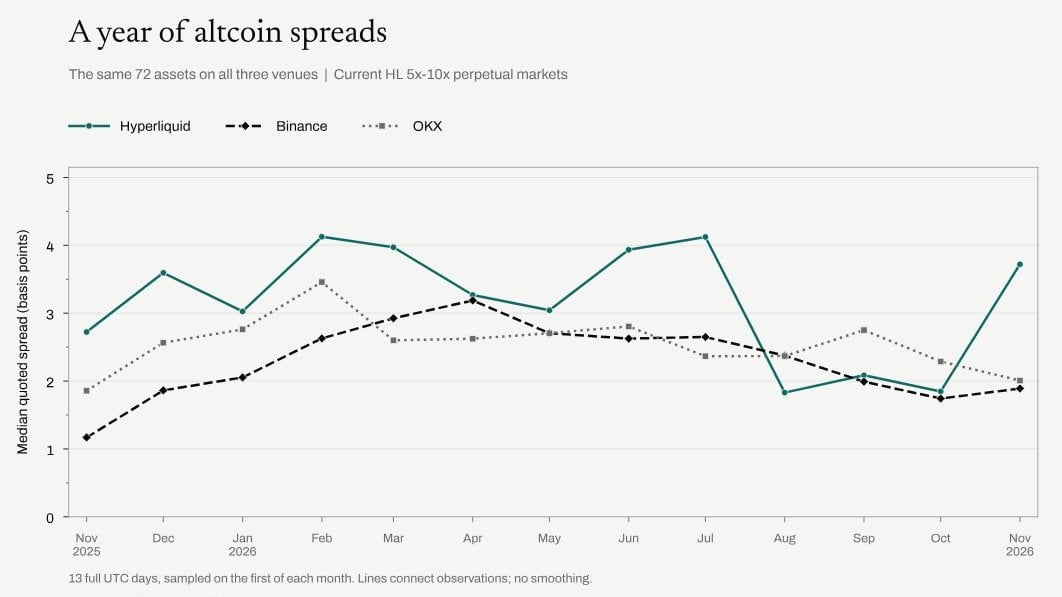
In another comparison, from May to late October–early November, dollar depth declined within 25 basis points while more distant depth and total posted orders rose. The ratio of 25-basis-point depth to both trading volume and open interest also fell. Across 72 long-tail tokens, the study reports wider spreads on all three venues over the year and a pronounced late-period rise on Hyperliquid. It notes that Binance’s spread grew faster in percentage terms from a lower starting point, while its final spread remained narrower.
What account activity can—and cannot—explain
To avoid counting linked subaccounts as separate participants, the researcher grouped them with their main accounts. Comparing a week a year earlier with a recent week across the same 80 markets, the median share of taker volume attributable to the largest account group fell from 25.2% to 14.6%. That does not support a simple account of one large trader dominating taker volume.
The more recent quoting data point in a different direction. Across 72 markets, between October 8–14 and October 31–November 6, the median share of displayed depth within 25 basis points supplied by each market’s largest account group rose from 34.5% to 38.6%, while the median quoted spread widened from 2.13 to 3.55 basis points. The median number of account groups posting at least $1,000 of valid quotes on both sides within that range fell from 7.64 to 6.39; 58 of the 72 markets saw a decline in quoting groups. The researcher also observed a large liquidity provider withdrawing many quotes around November 3.
These observations do not prove why quoting changed. The study flags a reported October 29 Binance security incident within the observation window and says the shift cannot be attributed entirely to priority fees or network congestion.
The smaller-maker constraint
For 54 account groups, the study calculated volume-weighted historical taker fees. The lowest-volume quartile paid 0.961 basis points, while the highest-volume quartile received a 0.236-basis-point rebate—a gap of about 1.2 basis points before hedging costs or slippage. The researcher argues that this places smaller market makers at a disadvantage when spreads are only a few basis points wide.
The analysis raises a related question for HIP-4 markets. It describes congestion quotas as based on an address’s weighted market-making share in the preceding UTC day, with an address able to use up to twice its share of block space during congestion. A participant may therefore need trading volume to secure quoting capacity while needing quoting capacity to build that volume. In a November 10 sample of 256 HIP-4 contracts, four professional wallets supplied 47% of displayed depth within 25 basis points of the mid-price. The author’s conclusion is that sustaining long-tail liquidity requires smaller quoting participants to remain able to submit orders; the data identify a risk to that supply, not a demonstrated outcome of any proposed mechanism change.
Source: panewslab.com (originally published 2026-11-12 11:48 UTC+8)